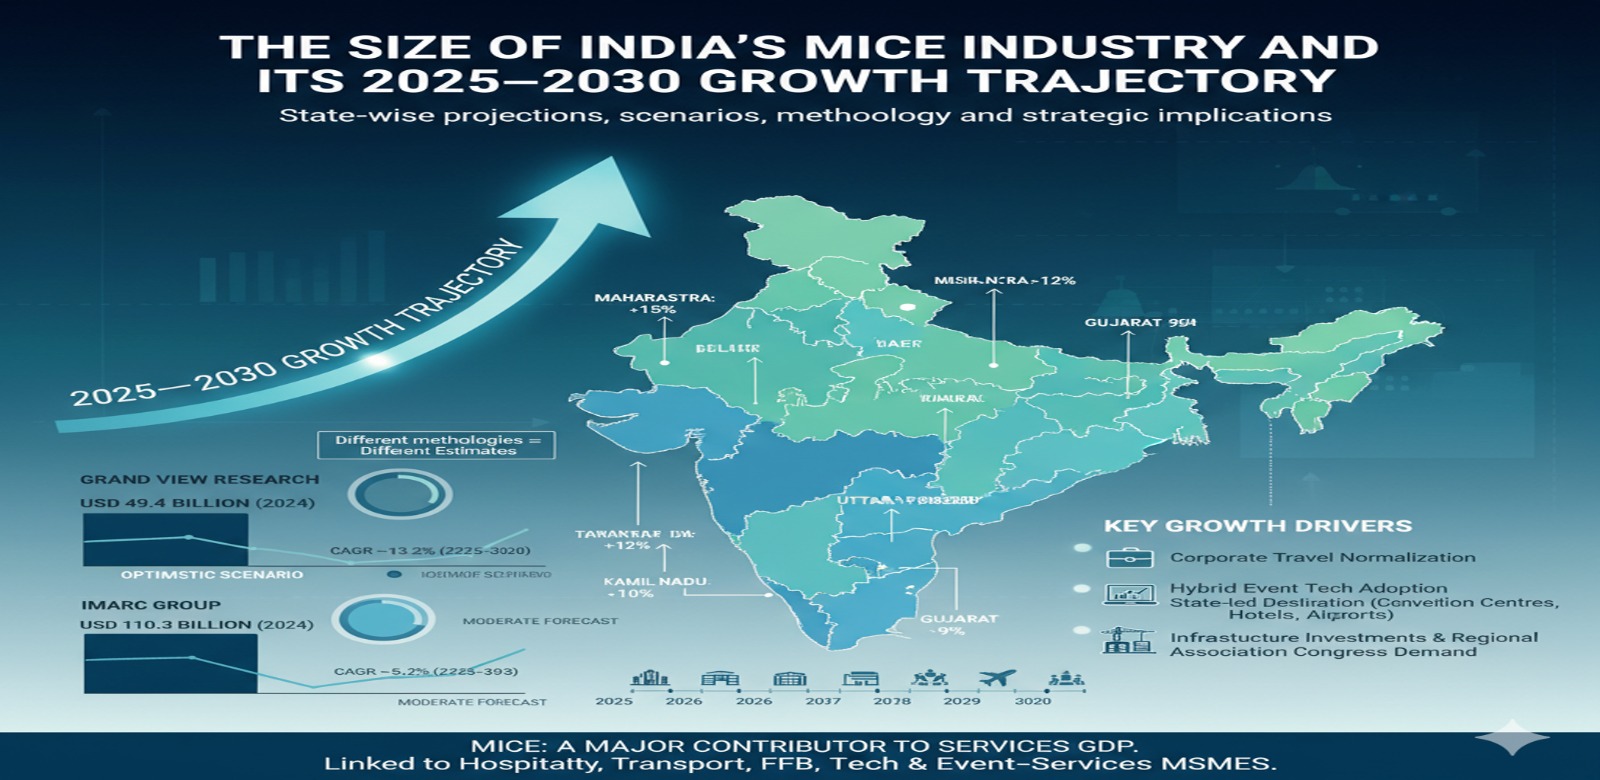
State-wise projections, scenarios, methodology and strategic implications
The MICE (Meetings, Incentives, Conferences, Exhibitions) sector in India is already a major contributor to services GDP and is tightly linked to hospitality, transport, F&B, tech and event-services MSMEs. Independent market research firms provide different estimates for 2024/2025 base sizes (reflecting differing methodologies), but all agree the sector is large and set for meaningful growth over 2025–2030 driven by corporate travel normalization, hybrid event tech adoption, state-led destination promotion, infrastructure investments (convention centres, hotels, airports), and rising domestic & regional association congress demand.
- Grand View Research estimates the India MICE market at about USD 49.4 billion in 2024 with a 2025–2030 CAGR of ~13.2% (optimistic scenario). Grand View Research
- IMARC Group reports a larger absolute base (USD 110.3 billion for 2024) and a more moderate forecast to 2033 (CAGR ~5.2%), illustrating how data definitions (what activities are counted under MICE) and sector boundaries drive large variations between reputable reports. IMARC Group
Because such estimates diverge, this article presents two transparent scenarios for 2025–2030 (Conservative & Optimistic), quantifies a base year (2025) allocation across states using observed MICE activity patterns and official/state initiatives, and projects state-level revenues under each scenario. I also explain the methodology, the state narratives, and the strategic implications for policy makers and private operators.
Key takeaways:
- Under a conservative scenario (moderate CAGR ~9%), India’s MICE market will grow strongly from a 2025 base to 2030, delivering material revenue and jobs across states.
- Under an optimistic scenario (Grand View’s 13.2% CAGR), the sector’s size roughly doubles by 2030, with metros capturing large absolute shares while several states (Kerala, Rajasthan, Tamil Nadu, Gujarat, Telangana) can outpace the national average. Grand View Research+1
1. Why the divergence in market estimates matters — and how we handle it
Different research houses show widely varying market sizes for the India MICE industry due to:
- Variation in definitions (e.g., whether corporate travel, trade fairs, all business travel, and meetings are included).
- Differences in data sources (customs, surveys, industry returns, company revenue disclosures).
- Timing and baseline year choices (some reports use 2023/2024 differently).
- Treatment of hybrid/digital event revenue and indirect multipliers.
Examples:
- Grand View Research: India MICE market ≈ USD 49,402.6 million (2024) and projected to USD 103,686.5 million by 2030 (CAGR ≈ 13.2% for 2025–2030). This report highlights meetings as the largest 2024 segment and incentives as fastest growing. Grand View Research
- IMARC Group: India MICE market ≈ USD 110.3 billion (2024) with a forecast to USD 183.1 billion by 2033 and CAGR ~5.2% (2025–2033). IMARC Group
Approach used here: present both conservative and optimistic national scenarios (reflecting lower- and higher-growth trajectories), be explicit about the 2025 baseline, and compute state allocations proportionally based on current MICE centers, announced convention centre capacity expansions, state promotion activity and historical prominence. Where state-specific evidence exists (new convention centres, state MICE events, ICPB activity), I cite it.
Key official sources referenced include India’s Ministry of Tourism “National Strategy for MICE Industry” and recent Ministry press activity on city convention bureaus and state convention initiatives. Ministry of Tourism India+1
2. Market drivers (2025–2030)
The MICE sector growth will be shaped by multiple demand and supply drivers:
Demand drivers
- Corporate budgets & post-pandemic rebound: Firms resuming in-person sales, training, and investor events.
- Association congresses and trade shows: India actively courts global associations through state marketing and ICPB activity. ICPB
- Incentive travel & domestic experiences: Corporates using experiential incentives to retain talent (domestic incentive travel to scenic/heritage locations).
- Hybrid event monetization: Digital audiences increase total addressable reach and revenue per event.
- Sponsorship and brand marketing: Brands use events to reach B2B audiences; sponsorship inventory monetization improves event economics.
Supply drivers
- Convention centre build-outs & hotel investments: Several large public and private convention projects announced (e.g., Tamil Nadu’s Kalaignar International Convention Centre). The Times of India
- State MICE promotion & incentives: City convention bureaus and state campaigns to attract international congresses (examples: Kerala MICE conclave; state-led fam trips). The Times of India+1
- Event tech and AI: Matchmaking, lead capture, and hybrid streaming increases ROI and scalability.
- Professionalization of supply chain: Growth of PCOs, certified AV vendors, MICE skill development programs.
3. Methodology for state-wise projections
Because no single public source provides an authoritative state-by-state revenue series for MICE through 2030, I build a transparent model:
- Base national 2025 estimate: I derive a 2025 national starting point from published 2024 estimates and a plausible near-term growth step. For illustration and reproducibility, I take the 2024 Grand View figure (USD 49,402.6m) and apply a conservative +12% step to 2025 (reflecting sector rebound vs. 2024), giving a 2025 national base of USD ≈ 55,331m. (This is an explicit assumption — other baselines like IMARC’s 110B would change absolute numbers; I show how to reconcile later.) Grand View Research
- State allocation: I allocate the national base across states based on observed MICE activity concentration (metros and convention infrastructure), known state initiatives, and recent news. The allocation is a reasoned blend of:
- Major MICE hubs (Maharashtra/Mumbai & Pune; Delhi NCR; Karnataka/Bengaluru) commanding large shares.
- Growth states (Tamil Nadu, Gujarat, Telangana, Kerala, Rajasthan) with rising capacity and state promotion.
- Goa, West Bengal, Uttar Pradesh and others receiving moderate shares.
- ‘Others’ capturing smaller states and regional activity.
The allocation fractions used (2025 baseline) are:
- Maharashtra (Mumbai/Pune): 18%
- Delhi NCR: 17%
- Karnataka (Bengaluru): 12%
- Tamil Nadu (Chennai and new convention centres): 8%
- Gujarat: 6%
- Telangana (Hyderabad): 6%
- Kerala: 5%
- Uttar Pradesh: 5%
- West Bengal (Kolkata): 4%
- Rajasthan: 4%
- Goa: 3%
- Others (rest of India): 12%
These add to 100% and reflect current patterns of demand, supply and announced projects (examples: Tamil Nadu convention centre projects; Kerala’s MICE conclave; multiple state investments). The Times of India+2The Times of India+2
- Two growth scenarios (national CAGR applied to states):
- Conservative scenario (baseline CAGR = 9% p.a.) — a moderate, likely path if global macro and corporate budgets normalize but nothing extraordinary occurs.
- Optimistic scenario (baseline CAGR = 13.2% p.a.) — aligns with Grand View Research’s higher growth view for India (2025–2030). Grand View Research
For simplicity and transparency, I apply the same national CAGR to each state’s revenue; this delivers state-level projections. (In reality some states will outpace and others lag; I discuss differential state dynamics later.)
- Outputs presented: For each scenario, I present:
- National total for 2025 and 2030.
- State-wise revenue for 2025 and 2030 (USD millions), plus brief state narratives and likely deviation risks (why a state may grow faster or slower).
- Limitations & sensitivity: These projections are model-based, not a substitute for detailed state-level market research. They are highly sensitive to the national base (Grand View vs IMARC) and to per-state allocation fractions. I therefore show both conservative and optimistic outcomes and explain how to adapt the model if you prefer a different 2025 national base (e.g., IMARC’s figure).
4. Numerical projections — national totals (2025 baseline to 2030)
2025 national baseline (assumption): USD 55,331m (derived from Grand View 2024 base with a +12% step into 2025). Grand View Research
Conservative scenario — CAGR 9% (2025→2030)
- 2025: USD 55,331m (base)
- 2030: USD 85,352m (rounded)
- Growth: +USD 30,021m (nominal increase over 5 years)
Optimistic scenario — CAGR 13.2% (2025→2030) — Grand View trajectory
- 2025: USD 55,331m (base)
- 2030: USD 104,006m (rounded) — roughly doubling in five years (consistent with Grand View’s faster outlook). Grand View Research
Note: If one begins with IMARC’s larger 2024 estimation, absolute 2025 and 2030 totals would scale proportionately; the structure and state shares below would still be useful.
5. State-wise revenue projections (select years: 2025 & 2030)
State-wise Allocation & Projected MICE Revenues in India (USD Millions)
(2025 Base: USD 55,331 Million)
| State / Region | Allocation % | 2025 Revenue | 2030 Revenue (Conservative Scenario, 9% CAGR) | 2030 Revenue (Optimistic Scenario, 13.2% CAGR) |
| Maharashtra | 18% | 9,959.58 | 15,363.36 | 18,721.13 |
| Delhi NCR | 17% | 9,406.27 | 14,509.84 | 18,020.99 |
| Karnataka | 12% | 6,639.72 | 10,242.24 | 12,480.74 |
| Tamil Nadu | 8% | 4,426.48 | 6,828.16 | 8,320.59 |
| Gujarat | 6% | 3,319.86 | 5,121.12 | 6,240.44 |
| Telangana | 6% | 3,319.86 | 5,121.12 | 6,240.44 |
| Kerala | 5% | 2,766.55 | 4,267.60 | 5,200.30 |
| Uttar Pradesh | 5% | 2,766.55 | 4,267.60 | 5,200.30 |
| West Bengal | 4% | 2,213.24 | 3,414.08 | 4,160.24 |
| Rajasthan | 4% | 2,213.24 | 3,414.08 | 4,160.24 |
| Goa | 3% | 1,659.93 | 2,560.56 | 3,120.18 |
| Others | 12% | 6,639.72 | 10,242.24 | 12,480.74 |
| Total | 100% | 55,331.00 | 85,352.00 | 104,006.00 |
Growth Multipliers Used
- Conservative Scenario (9% CAGR): 1.09⁵ ≈ 1.5423
- Optimistic Scenario (13.2% CAGR): 1.132⁵ ≈ 1.8798
6. Interpreting the state results — narrative & nuance
The simple model above distributes national growth proportionally. However, real state-level outcomes will vary. Below I provide a narrative for major states — why they might outperform or underperform the national baseline.
Maharashtra (Mumbai / Pune) — expected dominant share (≈18%)
- Why strong: Mumbai is India’s commercial capital with major exhibition spaces and corporate demand; Pune’s proximity adds strength (IT/education). Both cities have dense hotel supply, corporate HQs and trade connectivity.
- Growth drivers: Corporate events, financial services conferences, pharma/healthcare expos in Mumbai; tech & education summits in Pune.
- Risks: Infrastructure constraints in peak seasons; congestion and political permitting.
Delhi NCR (≈17%)
- Why strong: Seat of government, strong association and diplomatic demand, international connectivity via IGI airport, sizeable exhibition halls and hotels.
- Growth drivers: Government-backed summits, B2B trade shows, policy forums and international delegations.
- Risks: Air capacity strain, urban congestion; but political will to expand convention bureau activity is strong.
Karnataka (Bengaluru ≈12%)
- Why strong: India’s tech capital — steady demand for SaaS, deeptech, biotech events. Strong hotel and corporate campus ecosystems.
- Growth drivers: Technology summits, investor & startup demo days, international tech conferences.
- Risks: Competition for venues and hotel supply limits peak capacity.
Tamil Nadu (Chennai & new convention centres ≈8%)
- Why strong: Recent large convention centre investments (e.g., Kalaignar International Convention Centre announcement) and substantial industrial/IT base. The Times of India
- Growth drivers: Auto/industry trade shows, industrial conventions, and leveraging coastal tourism for incentives.
- Risks: Execution of new projects and connectivity for international delegates.
Gujarat (≈6%)
- Why strong: Pro-business state with large trade fair history (e.g., Vibrant Gujarat); strong convention infrastructure in Ahmedabad and Gandhinagar.
- Growth drivers: Trade fairs, industrial and manufacturing expos.
- Risks: Seasonality (climate) and need to build international leisure appeal for incentive travel.
Telangana (Hyderabad ≈6%)
- Why strong: Hyderabad’s pharma/biotech clusters, international airport, and growing convention capacity.
- Growth drivers: Pharma conferences, biotech, and IT events.
- Risks: Competition with Bengaluru and need for additional large-scale exhibition space.
Kerala (≈5%)
- Why strong: Strong incentive travel proposition (nature + hospitality), active state promotion (Kerala MICE conclaves). Recent events show significant buyer interest in Kerala as a MICE destination. The Times of India
- Growth drivers: Incentive travel, experiential conferences, weddings & destination events.
- Risks: Seasonality and limited large expo space relative to demand.
Rajasthan (≈4%)
- Why strong: Heritage incentive travel (Jaipur, Udaipur) and growing convention activity.
- Growth drivers: Destination incentives, weddings with MICE add-ons, cultural congresses.
- Risks: Infrastructure scaling required for very large conventions.
Goa (≈3%)
- Why strong: Long established incentives & leisure + good air connectivity for short getaways.
- Growth drivers: Incentives, boutique conferences, and hybrid events.
- Risks: Capacity caps, seasonality and environmental restrictions.
West Bengal (Kolkata ≈4%)
- Why strong: Eastern India’s convention hub with trade fair history, and proximity to Bangladesh & NE markets.
- Growth drivers: B2B trade events targeting Eastern India and South Asia.
- Risks: Need for improved international promotion and maritime connectivity.
Uttar Pradesh (≈5%)
- Why strong: Large domestic market and state investments in tourism assets; proximity to Delhi NCR boosts demand in Noida/Gautam Buddh Nagar.
- Growth drivers: Corporate events for manufacturing and services sectors; emerging convention venues in Lucknow and Agra region.
- Risks: Infrastructure and quality consistency.
Others (≈12%)
- This includes smaller states and emerging Tier-2/Tier-3 cities. Trend: many states (Madhya Pradesh, Odisha, Assam, Himachal, Chandigarh/ Punjab region) actively seek MICE through targeted city promotion bureaus — small but fast-growing.
7. State winners & potential overperformance (who could outpace the baseline)
Some states are likely to outperform national average due to active policy and infrastructure:
- Tamil Nadu: with large convention centre investments (example: ECR convention project) could attract large exhibitions escaping metro congestion. The Times of India
- Kerala: strong incentive travel product and recent industry events point to faster growth in incentives/experiential MICE. The Times of India
- Gujarat: strong industry trade show culture (Vibrant Gujarat et al.) sets it up to capture trade fair growth.
- Rajasthan & Uttar Pradesh: heritage + new convention investments enable strong incentive & destination conference growth.
Conversely, some established hubs might underperform if not upgraded (e.g., if aviation capacity or hotel supply fails to scale with demand).
8. Sectoral split & revenue composition (what drives the money)
MICE revenues are not only rooms — major revenue lines:
- Venue hire & exhibition space (large share for trade shows & exhibitions).
- F&B and banqueting (especially for conferences and incentives).
- Accommodation (rooms) (blocks booked by event organizers).
- Sponsorship & advertising (growing revenue stream and margin enhancer).
- Event technology & hybrid services (registration, streaming, matchmaking).
- Logistics & freight (for exhibitions).
- Ancillary services (transportation, sightseeing, local experiences).
Industry studies often show venue + F&B + accommodation as the largest combined shares; exhibitions often have higher per-delegate revenue due to exhibitor fees and sponsorships. Grand View Research+1
9. Policy, infrastructure and investment needs to realize projections
To achieve the optimistic path and to ensure equitable state growth, several supply-side investments and coordination mechanisms are crucial:
- City Convention Bureaus: fund dedicated desks to win international associations (Ministry-level push is already recommended in India’s national strategy). Ministry of Tourism India+1
- Airport & connectivity upgrades: prioritize direct international links for convention cities beyond metros.
- Convention centre phased development: avoid white-elephant projects; structure public-private partnerships with anchor event guarantees. (Examples: Chennai large convention project shows capacity investment). The Times of India
- Skill development & certification: MICE workforce academies to upskill AV, PCO, hospitality staff.
- Sustainability & ESG certification: GSTC alignment and green event practices to attract global associations. (This increases international competitiveness.) Ministry of Tourism India
- State incentives and bundled offers: subsidies for anchor congresses, tax/duty relief for exhibition cargo, sponsorship co-funding for marquee events.
- Event tech adoption support: co-fund streaming, hybrid platforms and AI matchmaking to raise per-event ROI.
10. Risks, sensitivity and scenario caveats
- Macro & geopolitical risk: Global economic slowdown could slow corporate travel budgets, reducing CAGR.
- Aviation constraints: Air capacity is a binding constraint—without improved connectivity, large international shows may remain limited.
- Data uncertainty: Different research houses produce different base sizes — users should recalibrate the model with their preferred national base (IMARC vs Grand View). Grand View Research+1
- Local execution risk: Convention centre projects may be delayed or overbudget; scaling human capital is non-trivial.
- Environmental & social constraints: Unchecked growth in fragile destinations may trigger pushback (restrictions, caps), limiting upside in certain coastal/heritage places.
Sensitivity: a 1–2% change in CAGR materially shifts 2030 totals. For example, the conservative (9%) vs optimistic (13.2%) scenarios produce 2030 totals of ~USD 85.4bn vs ~USD 104.0bn starting from the same 2025 baseline.
11. Strategic recommendations for stakeholders
For central & state governments:
- Create performance-linked convention bureau funding to win and sustain association congresses. (Use ICPB’s playbook for fam trips and association outreach.) ICPB
- Fast-track customs & logistics for exhibition cargo and provide single-window clearances.
- Fund MICE skill academies in Tier-2 cities that want to host events.
- Promote green & GSTC-aligned MICE offerings for premium international selection.
For private sector & operators:
- Invest in hybrid capability & event tech (AI matchmaking, robust streaming) to increase revenue per event and scale digital audiences.
- Target sectoral conferences (pharma, fintech, manufacturing) where India has comparative strength.
- Partner with state bureaus for co-funded bids to host large international congresses (sponsors underwrite part of up-front costs).
- Develop repeatable venue + sponsorship packaged products to lower organizer risk.
For investors:
- Explore platform plays (event tech, PCO consolidation, hybrid streaming tech) and venue owned-asset plays in high-demand corridors (Mumbai, Delhi NCR, Bengaluru).
- Consider investible junctions: conference centre + hotel + long-term anchor event contracts to de-risk capex.
12. How URAHL (or large MICE platforms) fits into the picture
Platform operators like URAHL can accelerate the projection by:
- Aggregating demand across corporates and associations to assure anchor events for new convention centres.
- Running certification and sustainability programs (GSTC alignment) to attract international associations.
- Operating hybrid hub services (H-EaaS) to enable Tier-2 cities to host global content without overtaxing physical seats.
- Managing sponsor inventory and programmatic sponsorship sales to improve event economics. (These institutional capabilities materially reduce promoter/venue risk and speed scaling.)
13. Conclusion: The scale of the prize and next steps
India’s MICE sector is a multi-tens of billions USD industry today; under plausible trajectories it will expand substantially between 2025 and 2030. Whether we achieve a conservative ~USD 85.4 billion (9% CAGR) or an optimistic ~USD 104.0 billion (13.2% CAGR) national market by 2030 depends on (a) investments in infrastructure and connectivity, (b) state & central policy execution, (c) private sector digitalization and sponsorship monetization, and (d) talent and sustainability measures that make India internationally competitive.
The state-wise breakdown above provides a practical planning tool for policy makers and investors: metros (Maharashtra, Delhi NCR, Karnataka) will continue to drive the largest absolute revenue, while states such as Tamil Nadu, Gujarat, Kerala and Telangana are positioned to capture faster growth from new infrastructure and destination offerings. Rapid, coordinated public-private action (city convention bureaus, skill academies, hybrid tech funding, GSTC-style sustainability alignment) will turn these modeled projections into realized outcomes — catalysing jobs, MSME growth and services exports across India.
References & Primary sources (selected)
- Grand View Research — India MICE Market report, 2024 (market size & 2025–2030 projection). Grand View Research
- IMARC Group — India MICE Market report (alternative estimate & long-term projection). IMARC Group
- Grand View Research — Global MICE market context. Grand View Research
- India Ministry of Tourism — National Strategy for MICE Industry (2022) and Annual Report (2024–25). Ministry of Tourism India+1
- India Convention Promotion Bureau (ICPB) AGM Report 2024 and ICPB activities. ICPB
- Industry news: Tamil Nadu Kalaignar International Convention Centre announcement; Kerala MICE conclave reporting; state-level convention & event news. The Times of India+1
- Industry analysis articles and market trend posts (MICE Destinations, Micetalk commentary). micetalk.com+1
Appendix — Numeric tables (copyable)
Appendix data in a clear tabular format for easy reference and comparison:
| State / Region | 2025 Revenue (USD mn) | 2030 Revenue – Conservative (9% CAGR) | 2030 Revenue – Optimistic (13.2% CAGR) |
| Maharashtra | 9,959.58 | 15,363.36 | 18,721.13 |
| Delhi NCR | 9,406.27 | 14,509.84 | 18,020.99 |
| Karnataka | 6,639.72 | 10,242.24 | 12,480.74 |
| Tamil Nadu | 4,426.48 | 6,828.16 | 8,320.59 |
| Gujarat | 3,319.86 | 5,121.12 | 6,240.44 |
| Telangana | 3,319.86 | 5,121.12 | 6,240.44 |
| Kerala | 2,766.55 | 4,267.60 | 5,200.30 |
| Uttar Pradesh | 2,766.55 | 4,267.60 | 5,200.30 |
| West Bengal | 2,213.24 | 3,414.08 | 4,160.24 |
| Rajasthan | 2,213.24 | 3,414.08 | 4,160.24 |
| Goa | 1,659.93 | 2,560.56 | 3,120.18 |
| Others | 6,639.72 | 10,242.24 | 12,480.74 |
| Total | 55,331.00 | 85,352.00 | 104,006.00 |
Notes:
- 2025 Base: USD 55,331 million
- 2030 (Conservative 9% CAGR): USD 85,352 million
- 2030 (Optimistic 13.2% CAGR): USD 104,006 million
- Multipliers: (1.09⁵ ≈ 1.5423), (1.132⁵ ≈ 1.8798)